


CTR, CPC, CR, EPC, ROI — five abbreviations a media buyer uses to decide whether to keep spending or kill a campaign. The problem is that they are usually explained one by one, while decisions are made on a combination of metrics. This guide puts every formula on one cheat sheet and adds a worked example from impression to profit, break-even limits, a "which metric dropped — what to change" table and the counting mistakes that make buyers kill profitable campaigns.
The media buyer's funnel: where each metric lives
Every affiliate campaign is a funnel: impressions turn into clicks, clicks into leads or sign-ups, leads into approved conversions, and those into money. Each step between stages has its own metric. Hence the main diagnostic rule: when results drop, find the stage where conversion fell and fix that stage — not everything at once.
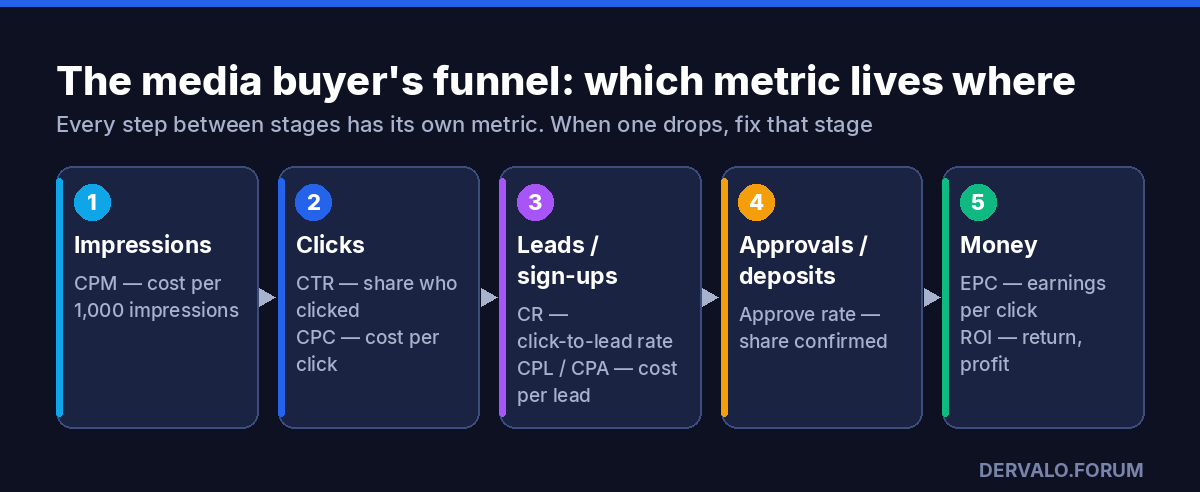
Metrics fall into two groups. Cost metrics — CPM, CPC, CPL/CPA — show how much you pay per unit of traffic or result. Efficiency metrics — CTR, CR, approve rate, EPC, ROI — show how well traffic turns into money. Profit appears only where efficiency outweighs cost.
Cheat sheet: every formula in one place
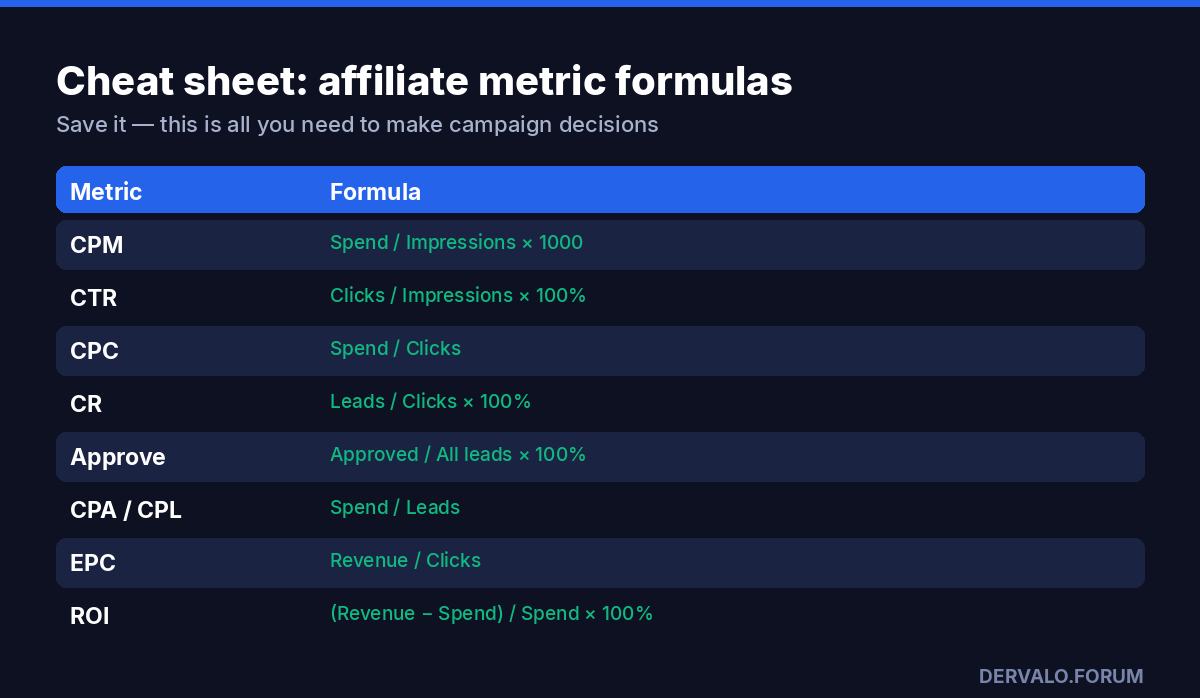
Before going through each metric, here are the formulas together. Save the image or bookmark the page — this set is enough for any campaign decision.
CPM — cost per thousand impressions
CPM (cost per mille) is what you pay for 1,000 ad impressions. Formula: CPM = Spend / Impressions × 1000. On Facebook, TikTok and most auction-based sources CPM is the first metric the algorithm sets: it depends on geo, audience, placements, auction competition and ad quality.
A high CPM on its own is not a verdict: an expensive impression can pay off if the audience has money and converts well. But a sharp CPM rise on the same settings signals that the audience is saturated or the ad gets a low quality score. How campaign structure and the ABO vs CBO choice affect CPM is covered in the guide on Facebook Ads campaign structure.
CTR — ad click-through rate
CTR (click-through rate) is the share of people who clicked the ad after seeing it. Formula: CTR = Clicks / Impressions × 100%. It is the main creative metric: it shows how well the image, video or copy hooks the audience.
Two things to remember about CTR:
- CTR can't be compared across sources and formats. Push, popunder, TikTok in-feed video and a native banner have fundamentally different click-through rates. Compare CTR only within one source, format and geo — and against your own history.
- High CTR ≠ good creative. A clickbait creative that promises something the lander doesn't deliver gets a high CTR and a low CR. The click is cheap but the lead is expensive. Judge creatives by cost per result, not by click-through.
When CTR on an old creative falls day after day, that's burnout. The fix is creative rotation and new angles, not a higher bid.
CPC — cost per click
CPC (cost per click) is what you pay on average for one visit. Formula: CPC = Spend / Clicks. CPC is tied directly to the two previous metrics: CPC = CPM / (CTR × 10) when CTR is expressed in percent. So there are two ways to lower CPC — cheaper impressions or higher click-through. The second is usually faster: a strong creative cuts click cost more than audience tweaks do.
CPC has a ceiling above which the campaign loses money — see the break-even section below.
CR — click-to-lead conversion rate
CR (conversion rate) is the share of clicks that turned into the target action: a form submission, sign-up, install or deposit. Formula: CR = Leads / Clicks × 100%. If CTR is the creative metric, CR is the metric of the lander, prelander and the offer itself.
CR depends on how well the ad's promise matches the lander, page load speed (especially on mobile traffic), language and geo localisation, form length and trust in the page. Be clear about what counts as a "lead": in gambling it is usually a registration while the payout is for the first deposit, so it helps to track two CRs — click → registration and registration → deposit.
Approve rate — share of confirmed conversions
Approve rate is the share of leads that passed the advertiser's check and will be paid. Formula: Approve = Approved / All leads × 100%. In cash-on-delivery (COD) nutra it is the key metric: the call centre doesn't reach everyone and some customers cancel. In CPL offers the network filters fraud and duplicates. In gambling the equivalent is the share of deposits that meet the offer's baseline.
The most common beginner mistake is counting revenue on all leads rather than approved ones. While a lead is on hold, it isn't money.
CPL and CPA — cost per lead and cost per action
CPL (cost per lead) and CPA (cost per action) are what one conversion costs you. The formula is the same: CPA = Spend / Conversions; the only difference is what counts as a conversion. It gets confusing because CPA is also the name of a network payout model — more on payout models in the article "Affiliate payout models: CPA, CPL, CPS, RevShare, Hybrid".
Compare CPL with the payout adjusted for approve rate. If an offer pays $25 per approved lead at a 50% approve rate, each lead you send is effectively worth $12.50, and a CPL above that means a loss.
EPC — what one click earns
EPC (earnings per click) is average revenue per click. Formula: EPC = Revenue / Clicks. It is the most convenient metric for comparing offers and setups because it already combines CR, approve rate and payout. An EPC of 0.50 means each click brings in half a dollar on average.
Networks often show an offer's network-wide EPC. Use it as a reference, not a promise: the average is built from many buyers' traffic with different sources and geos. You'll know your own EPC only after testing. Compare EPC with CPC and you immediately see whether you are in profit: EPC above CPC — the campaign makes money.
ROI — return on investment
ROI (return on investment) is the bottom-line metric: how much you earned per dollar spent. Formula: ROI = (Revenue − Spend) / Spend × 100%. An ROI of 50% means every $100 of spend returned $150 of revenue, i.e. $50 profit. 0% is break-even, negative ROI is a loss.
Don't confuse ROI with margin. Margin is calculated from revenue: (Revenue − Spend) / Revenue. On the same numbers a 50% ROI equals a 33% margin. Media buyers usually talk ROI, but in reports and with partners make clear which formula you use.
Worked example: from impression to profit
The theory clicks once you see every metric on the same numbers. Below is an illustrative example (numbers chosen for clarity, not a benchmark): $300 spend, $25 payout per approved lead.
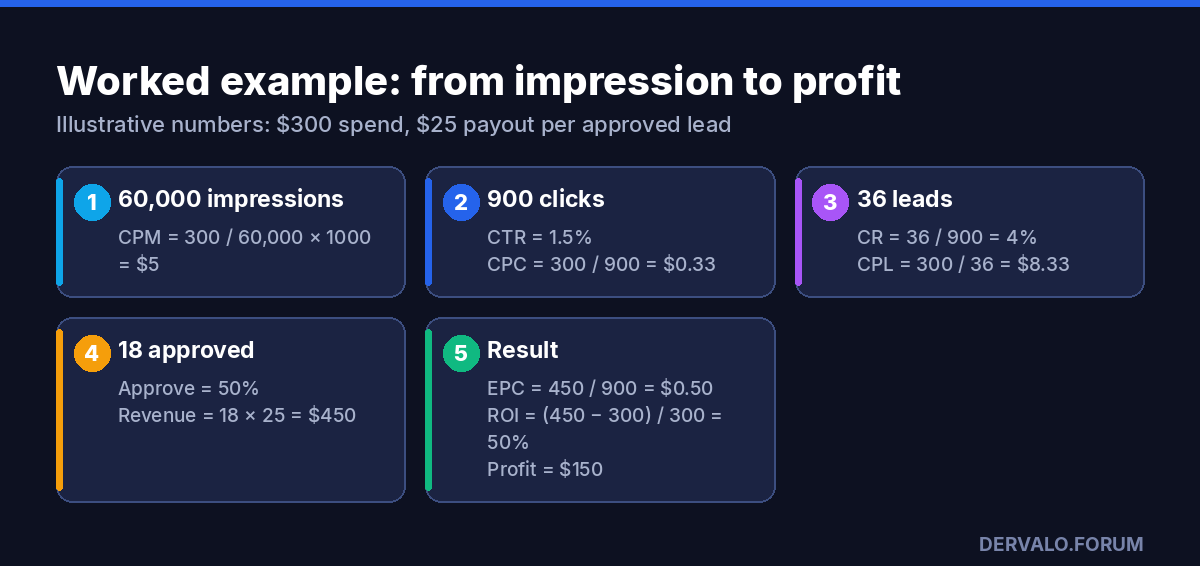
- 60,000 impressions for $300 give a $5 CPM.
- 900 clicks — 1.5% CTR, $0.33 CPC.
- 36 leads — 4% CR, $8.33 CPL.
- 18 approved — 50% approve, revenue 18 × $25 = $450.
- EPC = 450 / 900 = $0.50, ROI = (450 − 300) / 300 = 50%, profit $150.
Note: had the buyer counted revenue on all 36 leads, they would have seen $900 and a 200% ROI — and scaled the campaign expecting profit that doesn't exist.
Break-even: three limits to set before launch
The most useful calculations happen before the campaign starts. Knowing the payout and expected approve rate, you define the limits beyond which the setup loses money:
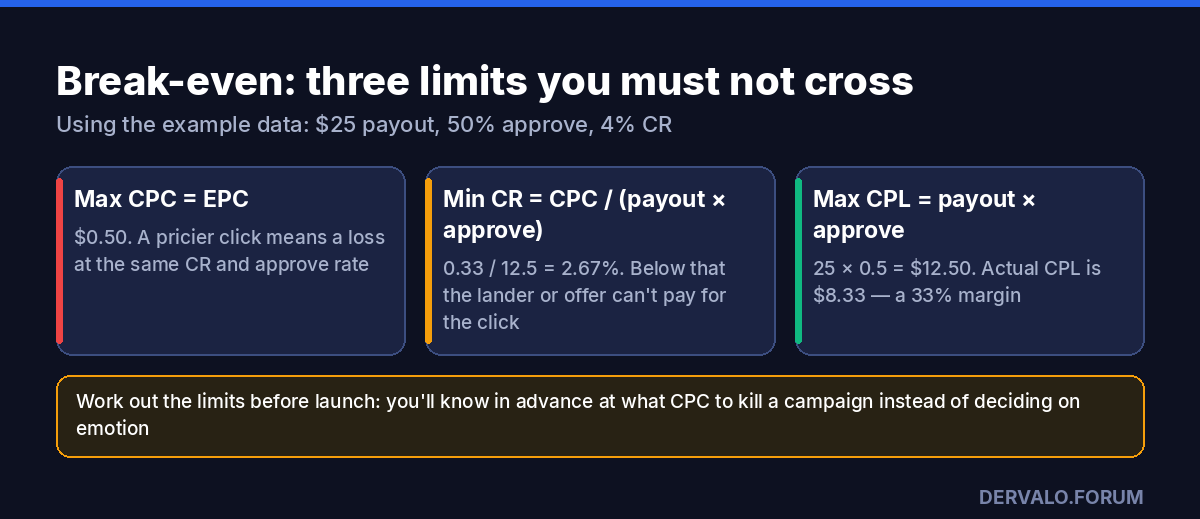
- Max CPC = EPC. If a click costs more than it earns, no creative will save it — you need a higher CR or payout.
- Min CR = CPC / (payout × approve). In the example: 0.33 / (25 × 0.5) = 2.67%. If the test CR is lower, the problem is the lander or the offer.
- Max CPL = payout × approve. $12.50 in the example. The actual $8.33 CPL leaves a one-third margin — room to scale even if lead cost rises.
Write these three numbers down before the test. Then "kill or wait" is decided by a known limit rather than by emotion after a bad day.
Which metric dropped — what to change
Diagnose top-down through the funnel and change one element at a time, otherwise you won't know what worked.
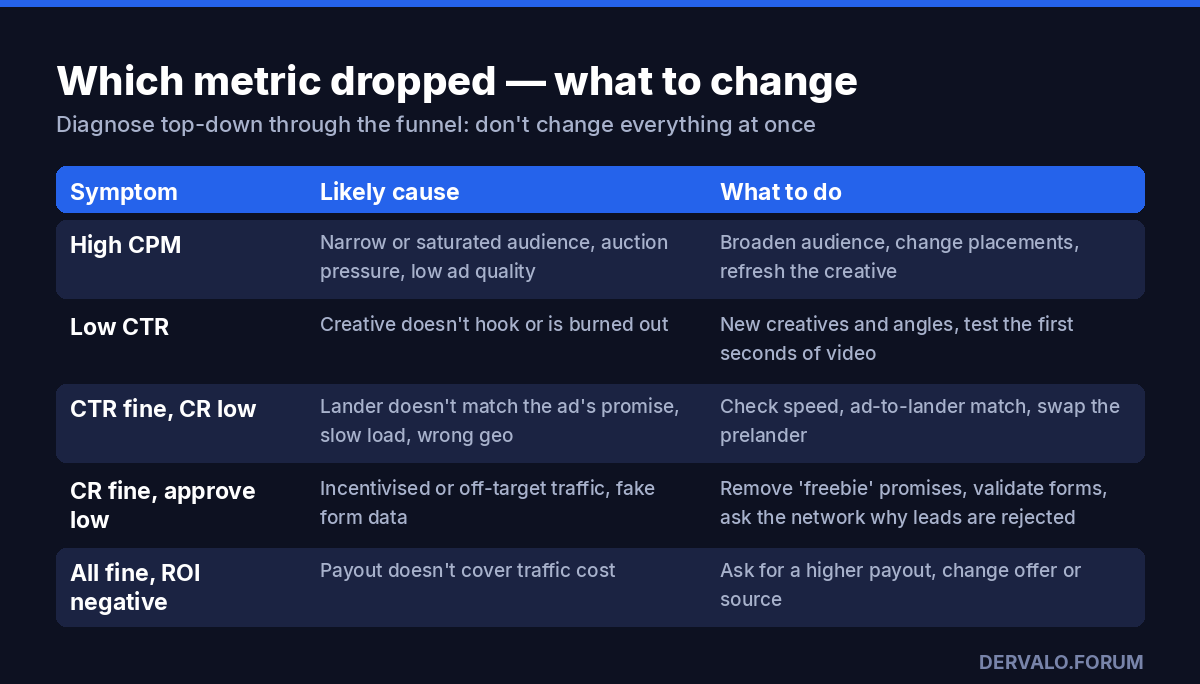
- High CPM — narrow or saturated audience, heavy auction competition, low ad quality. Broaden the audience, test other placements, refresh the creative.
- Low CTR — the creative doesn't hook or is burned out. You need new creatives and angles; in video the first seconds decide.
- CTR fine, CR low — the lander doesn't match the ad's promise, loads slowly or isn't localised for the geo. Check speed and ad-to-page match, test another prelander.
- CR fine, approve low — off-target or incentivised traffic, fake form data. Remove "freebie" promises from creatives, add field validation, ask the network why leads were rejected.
- All fine, ROI negative — the payout doesn't cover traffic cost. Ask your manager for a higher payout, change the offer or the source.
If conversions in the tracker and the network don't match, check data transfer first — the usual causes are in the article "Postback not firing: 12 mistakes".
The key metric depends on the payout model and vertical
The formulas are the same, but the focus differs by vertical:
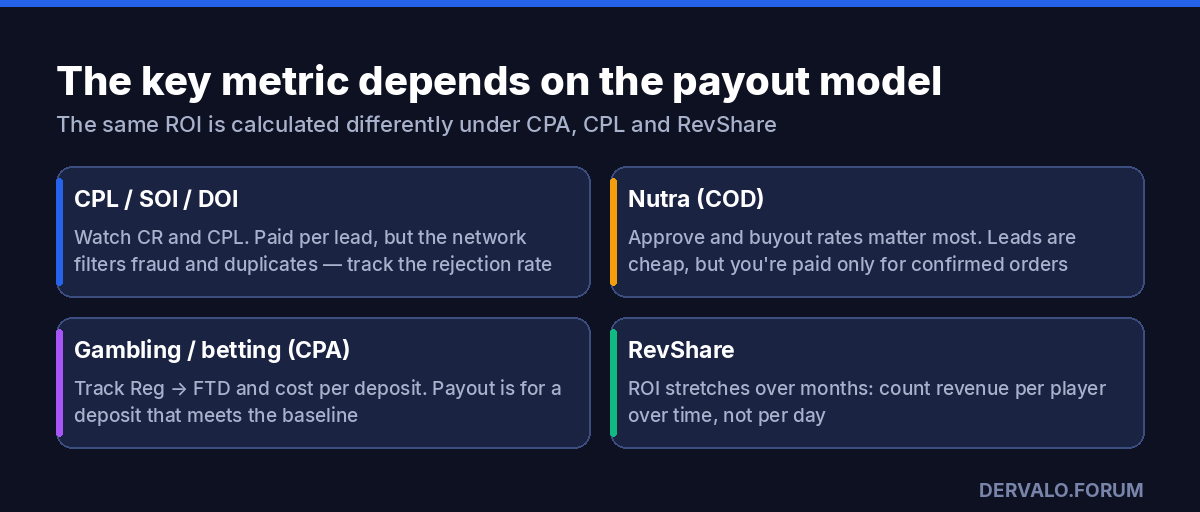
- CPL / SOI / DOI — paid per lead or sign-up. Watch CR and CPL plus the rejection rate: the network filters fraud and duplicates.
- Nutra (COD) — leads are relatively cheap, but only confirmed orders are paid. The key metrics are approve and buyout rates.
- Gambling and betting (CPA) — paid for a first deposit that meets the baseline. Track registration-to-deposit conversion and cost per deposit. FTD, baseline and NGR are covered in the gambling vertical breakdown.
- RevShare — revenue stretches over months, so daily or weekly ROI says little. Count revenue per player over time.
Why numbers don't match: ad account, tracker, network
The ad account, tracker and affiliate network almost never show identical numbers. That's normal — each system counts its own way. What matters is knowing which source to trust for each metric:
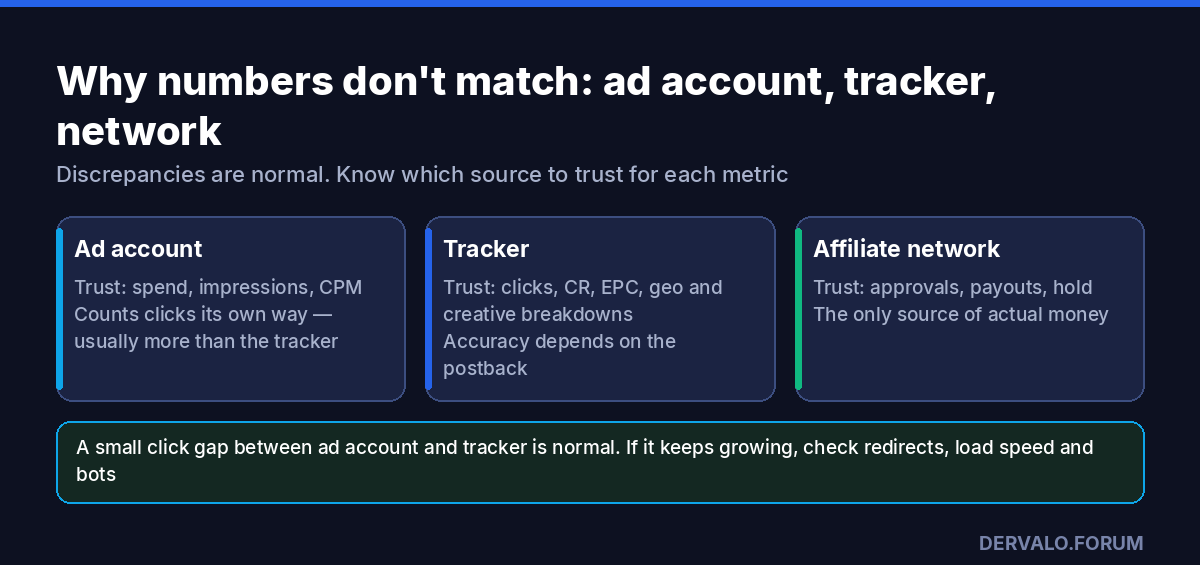
- Ad account — the source of truth for spend, impressions and CPM. It counts clicks its own way, so they rarely match the tracker.
- Tracker — clicks, CR, EPC and breakdowns by geo, device and creative. Its accuracy depends on a correct postback. How to pick a tracker for your volume is in our comparison of Keitaro, Binom, Voluum, RedTrack and BeMob.
- Affiliate network — the only source of actual money: approvals, payouts, hold. Calculate ROI from its data.
How conversions flow from the network to the tracker and on to the ad account is covered in the article on postbacks and S2S tracking.
7 mistakes in counting metrics
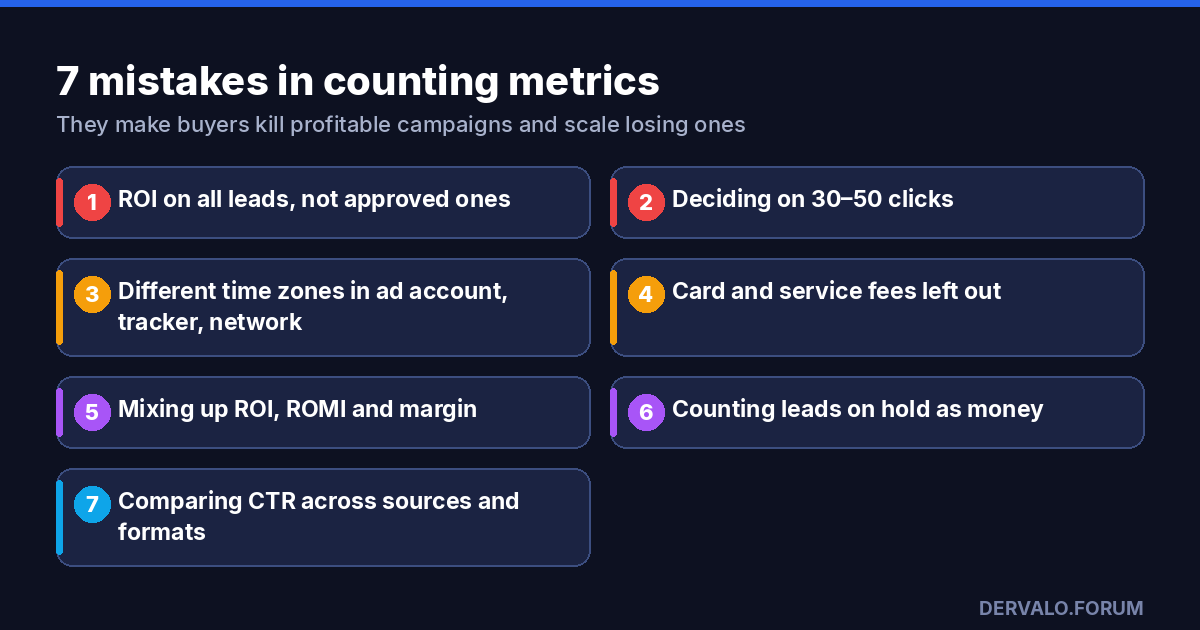
- ROI on all leads instead of approved ones. Inflates revenue several times over and leads to scaling a losing setup.
- Deciding on 30–50 clicks. On a small sample one random conversion changes CR several-fold. Wait for enough volume that results stop jumping.
- Different time zones. Ad account, tracker and network in different zones — and "yesterday" never matches. Use one zone wherever possible.
- Fees left out. Card top-ups, currency conversion, service subscriptions — all of it is spend. How to count the full cost of cards is in the article "Facebook Ads payment failed".
- Mixing up ROI, ROMI and margin. Different formulas give different percentages on the same numbers.
- Counting leads on hold as money. Until the hold ends, some leads may be rejected.
- Comparing CTR across sources and formats. Push and TikTok video can't be measured with the same ruler.
FAQ
What is EPC in affiliate marketing, in simple terms?
EPC (earnings per click) is the average revenue one click brings. It's revenue divided by clicks. If EPC is higher than cost per click (CPC), the campaign makes money.
How do you calculate ROI in affiliate marketing?
ROI = (Revenue − Spend) / Spend × 100%. Take revenue only from approved conversions in the network, and spend from the ad account plus card and service fees.
What's the difference between CR and CTR?
CTR shows what share of people who saw the ad clicked it — a creative metric. CR shows what share of those who clicked completed the target action — a lander and offer metric.
What is a good CTR?
There's no universal benchmark: CTR depends heavily on source, format, geo and vertical. Compare CTR with your own history in the same source and format, and judge creatives by cost per result, not just click-through.
What is approve rate in CPA?
Approve rate is the share of leads the advertiser confirms and pays for. It matters most in cash-on-delivery nutra, where some orders are cancelled after the call-centre call.
How is ROI different from margin?
ROI is calculated from spend, margin from revenue. With $150 revenue and $100 spend, ROI is 50% and margin is 33%.
Where should I look at metrics: ad account, tracker or network?
Spend and CPM in the ad account; clicks, CR and EPC in the tracker; approvals and payouts in the network. ROI is calculated correctly by combining tracker and network data.
Tricky cases — say, CR is high but approve rate keeps falling — are easier to solve with numbers in hand. Ask on the DERVALO forum, and find tools for tracking and analytics in the services catalog.